Grain and Soybean Production and Storage in Virginia: A Summary and Spatial Examination
ID
AAEC-60P
 EXPERT REVIEWED
Grain and soybean production is a critical component of Virginia agriculture — the state’s No. 1 industry (VDACS 2013). Virginia’s farmers produced more than half a billion bushels of grain and soybeans over the span of 2006 to 2012 (USDA-NASS 2013b)1. The objectives of this publication are to characterize the market for grain production and storage in Virginia. Specifically, this paper will:
- Highlight and examine the current characteristics and trends of Virginia grain and soybean production and storage.
- Provide an overview of the types, volume, and location of Virginia grain production.
- Show how much storage existed across time and where it is located.
- Identify future constraints and opportunities in production and storage in Virginia.
- Offer market insight for industry stakeholders.
I. Production: Types and How Much
Varying substantially in acres planted and bushels produced, seven grain crops (barley, corn, grain sorghum, oats, rye, triticale, and wheat) and soybeans are grown in Virginia (USDA-NASS 2009). Although technically an oilseed, for the purpose of this discussion, soybeans will be included in the “grains” category. Table 1 displays data from the U.S. Department of Agriculture’s National Agricultural Statistics Service (NASS) for the average number of acres planted and harvested from 2008 to 2012 for Virginia’s primary grain crops2. These data are for Virginia grain grown conventionally as opposed to organic grain. According to the latest available numbers from the Economic Research Service (2011), little organic grain is produced in Virginia (USDA-ERS 2014)3.
| Annual Acreage | Barley | Corn | Soybeans | Wheat |
|---|---|---|---|---|
| Total acres planted | 72,000 | 488,000 | 574,000 | 258,000 |
Acres harvested for grain/seed Share (%) |
46,800 65% |
68% | 562,000 98% |
227,000 88% |
Acres harvested for silage Share (%) |
Not reported | 139,000 29% |
Not applicable | Not reported |
Acres harvested remaining Share (%) |
25,200 35% |
15,000 3% |
12,000 2% |
31,000 12% |
| Total production (bushels) | 3,730,400 | 35,378,000 | 19,946,000 | 14,663,000 |
Note: Values reflect averages over production from 2008-12. Source: USDA-NASS (2013b) and authors’ calculations.
NASS only reports the acres of corn and grain sorghum (a relatively insignificant crop grown in Virginia) that are harvested for silage. However, given barley’s large remaining share of 35 percent, it can be implied that a substantial proportion of barley is grown for forage. Soybeans and wheat, on the other hand, are primarily harvested for seed and grain, respectively, in Virginia.
The most recent annual production data (2008-12) for Virginia’s four main grain crops is shown in table 2. Although Virginia produced a record high 86 million bushels of grain in 2011, total grain output decreased by 8 percent in 2012. In the last 20 years, grain output came close to 2011’s peak production level in only two years, with 85.4 million bushels produced in 2000 and 85.7 million bushels produced in 2004.
Figure 1 illustrates the movements in total grain production and the relative shares of barley, corn, wheat, and soybean production in Virginia by decade.
| Year | Barley | Corn | Soybeans | Wheat | Total |
|---|---|---|---|---|---|
| 2012 | 3,034,000 | 36,050,000 | 24,360,000 | 15,600,000 | 79,044,000 |
| 2011 | 6,160,000 | 40,120,000 | 22,000,000 | 17,750,000 | 86,030,000 |
| 2010 | 3,216,000 | 20,770,000 | 14,040,000 | 7,905,000 | 45,931,000 |
| 2009 | 3,182,000 | 43,230,000 | 21,090,000 | 12,180,000 | 79,682,000 |
| 2008 | 3,060,000 | 36,720,000 | 18,240,000 | 19,880,000 | 77,900,000 |
Source: USDA-NASS (2013b).
Figure 1 reveals that Virginia saw a generally positive trend in total grain production during the period examined. Due to increased production levels of corn, soybeans, and wheat, notable production expansion occurred during the 1970s and into the 1980s. This shift is mainly composed of higher corn yields (despite substantially lower harvested corn acreage compared to earlier decades) and more harvested acres of soy-beans and wheat.
Also, the same figure reveals that, from the 1920s to the 1940s, the share of corn in total production was more than 70 percent. Despite a reduction over time, corn’s share was still a leading 45.6 percent in 2012. Corn and wheat were the prominent grains produced in Virginia from the 1920s to the 1950s. However, displacing the proportions of other grains, soybeans experienced a widening share since the 1920s. Finally, the proportion of barley increases until the 1960s, declines slightly, and steadies thereafter.
Figure 2 displays recent annual production levels of different grain types to showcase current trends in the state’s grain sector.
Though production levels certainly vary annually, there is a slight upward trend in total production across the 25-year time span considered. Over the last five years (2008-12), the average shares of total production for these four grain crops are as follows: (1) 47.8 percent corn, (2) 27.4 percent soybeans, (3) 19.7 percent wheat, and (4) 5.2 percent barley4.
It is useful to consider these production responses in light of relevant environmental conditions. Table 3 presents the proportions of the examined crop years in years of low and normal production. Low-productivity years were determined by looking at the average corn yield in Virginia from 1988 to 2012, computing quartiles, and selecting years when Virginia’s corn yield was at or below the first quartile. Considering the entire period, relatively low-production years demonstrate different shares of barley, corn, soybeans, and wheat compared to normal years.
| Production Year | Barley | Corn | Soybeans | Wheat |
|---|---|---|---|---|
Low production years (1988, 1991, 1993, 1998-99, 2002, 2010) |
9.0% | 44.3% | 24.5% | 22.2% |
Normal production years (1989-90, 1992, 1994-97, 2000-01, 2003-09, 2011-12) |
6.0% | 52.8% | 22.9% | 18.3% |
All years (1988-2012) |
6.9% | 50.4% | 23.4% | 19.4% |
In low-productivity years, barley, soybeans, and wheat increased in their share of total production at the expense of corn. On the other hand, years with relatively normal production levels witnessed a higher proportion of corn. These results suggest that, in Virginia, corn yields are more vulnerable to drought than the other considered crops.
II. Locations of Production
According to the 2007 Census of Agriculture, Virginia’s corn, soybeans, wheat, and barley had a combined market value of $268.3 million in 2007, with individual contributions of $115.3 million, $98 million, $51.2 million, and $3.9 million, respectively (USDA-NASS 2009). Using county-level information from the same census, table 4 shows the top five producing counties for barley, corn, soybeans, and wheat in 20075. Westmoreland County and Rockingham County were the largest producing areas for barley, while Accomack County and Augusta County ranked first and second for corn, respectively (USDA-NASS 2009). Notably, Northumberland, Accomack, and Essex counties rank among the top five producing counties for multiple grains.
Table 4 (see page 4) also reports the top producing counties’ share of total state production for each grain. These numbers indicate that the state’s grain production is concentrated in a few regions rather than evenly spread across the state. For each of the examined grains, 30 percent or more of the production output is concentrated in just five counties. It is worth noting that in 2007, 9.8 percent of Virginia’s total grain production originated in Accomack County6.
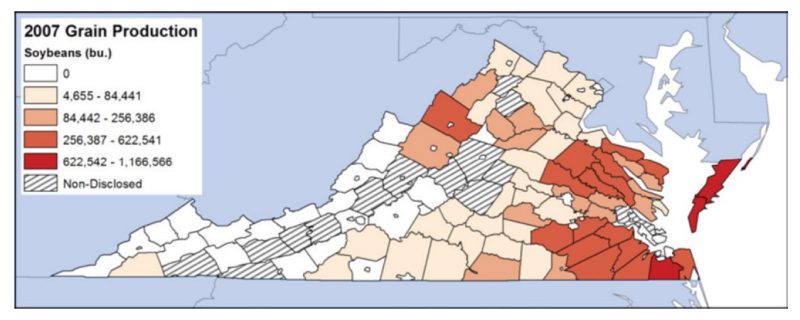
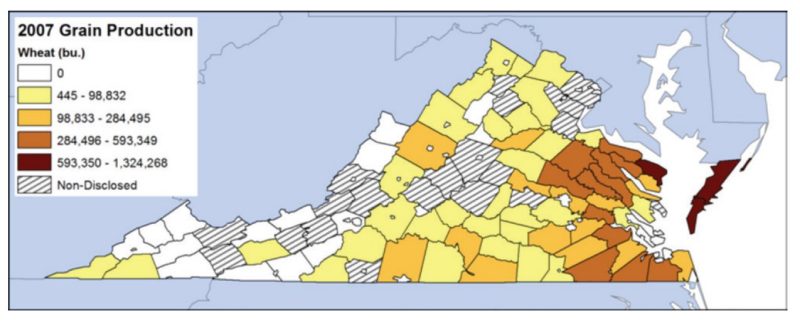
Figures 3 through 6 depict the location and volume of county-level grain production. Categories in all subsequent maps were developed using the Jenks’ optimization method, a technique that minimizes the variance within groups and maximizes the variance between groups7.
| Rank | County/city | Volume (bu) |
|---|---|---|
| 1 | Westmoreland | 194,825 |
| 2 | Rockingham | 173,112 |
| 3 | Essex | 143,805 |
| 4 | Augusta | 136,852 |
| 5 | Northumberland | 95,218 |
| Total | 743,812 | |
| Total barley production (Va.) | 2,008,416 | |
| Top five share of total | 37.0% |
| Rank | County/city | Volume (bu) |
|---|---|---|
| 1 | Accomack | 3,902,761 |
| 2 | Augusta | 2,001,675 |
| 3 | Rockingham | 1,701,405 |
| 4 | Chesapeake | 1,391,272 |
| 5 | Northampton | 1,365,312 |
| Total | 10,362,425 | |
| Total corn production (Va.) | 34,811,582 | |
| Top five share of total | 29.8% |
| Rank | County/city | Volume (bu) |
|---|---|---|
| 1 | Accomack | 1,166,566 |
| 2 | Chesapeake | 886,279 |
| 3 | Northampton | 760,208 |
| 4 | Southampton | 622,541 |
| 5 | Hanover | 534,365 |
| Total | 3,969,959 | |
| Total soybean production (Va.) | 12,624,547 | |
| Top five share of total | 31.4% |
| Rank | County/city | Volume (bu) |
|---|---|---|
| 1 | Northampton | 1,324,268 |
| 2 | Accomack | 980,123 |
| 3 | Northumberland | 816,833 |
| 4 | Westmoreland | 593,349 |
| 5 | Essex | 538,426 |
| Total | 4,252,999 | |
| Total wheat production (Va.) | 12,345,217 | |
| Top five share of total | 34.5% |
Note: Rankings do not take into account nondisclosed counties and independent cities.
Source: USDA-NASS (2009).
Overall, corn, soybean, and wheat production is concentrated in Eastern Virginia (east of Interstate 95). Figure 3 summarizes Virginia’s barley production and shows its concentration in the Shenandoah Valley, Northern Neck, and Middle Peninsula.
As shown in figure 4, much of the state’s corn production is generated in the Eastern Shore, Shenandoah Valley, Tidewater region, Northern Neck, and Middle Peninsula. Of note, Augusta and Rockingham counties in the Shenandoah Valley are two of the top five producing counties for both barley and corn, with much of the corn acreage harvested for silage (table 1). Accomack County, on the Eastern Shore, is particularly intensive in corn production, producing almost 2 million bushels more than the second-highest corn-producing county.

As would be expected given the pattern of corn production, much of the state’s soybean production is concentrated in the Eastern Shore and counties east of Interstate 95 (fig. 5). In particular, Accomack and Northampton counties and the City of Chesapeake are major production areas for both corn and soybeans.
Finally, akin to corn and soybeans, the Eastern Shore and counties east of I-95 are important areas for wheat production (fig. 6). Three counties in the Northern Neck and Middle Peninsula (Essex, Northumberland, and Westmoreland) are among the top five producing regions for both wheat and barley.
Areas of concentration of the examined grains also reflect the local agriculture requirements. For instance, production in the Shenandoah Valley is dominated by the need to provide forage and grain for livestock herds and poultry. On the other hand, grain in Eastern Virginia serves export markets and the regional demand of the poultry and swine industries.
III. Storage: Types and Capacity
A comprehensive examination of grain production also requires consideration of the capacity and location of grain storage. Storage facilities allow grain to move according to signals in the market rather having it all enter the system at harvest (Kohls and Uhl 1997). For producers, advantages include capturing higher prices later in the marketing year, increased flexibility in where and when grain is sold, faster harvest times, and the ability to withdraw grain throughout the year for animal feed (Edwards 2010).
Normally, grain is held and stored in two different ways: on-farm storage structures and off-farm (commercial) facilities (Dhuyvetter 1999). These two broad categories may be subdivided into four options: (1) investment in on-farm storage, (2) renting on-farm storage, (3) investment in condominium storage built by a commercial elevator, and (4) renting commercial storage. Each of these alternatives comes with advantages and disadvantages to grain producers (Edwards 2010).
- An investment in on-farm storage gives a producer greater flexibility in deciding when and where to market the crops, guaranteed available storage space, convenient management of stored grains, quicker transportation times during harvest, and financing available from the Farm Service Agency.
- Renting on-farm storage also offers certain advantages, including more efficient harvest due to more convenient storage capacity, rental rates that may be lower than those from commercial facilities, rental agreements that are usually only for one year at a time, and flexibility in deciding when and where to market crops.
- Off-farm grain storage capacity consists of “all elevators, warehouses, terminals, merchant mills, other storage, and oilseed crushers” and farm grain storage capacity includes “all bins, cribs, sheds, and other structures located on farms that are normally used to store whole grains, oilseeds, or pulse crops” (USDA-NASS 2013a). The advantages of investment in storage at a commercial elevator include: the elevator may be able to build storage capacity at a lower cost per unit, the elevator handles the grain and guarantees quality, no additional transportation and handling is required if the elevator merchandises the grain, and storage capacity can be sold if it is no longer needed.
- The advantages to renting commercial storage include: the producer pays only for the exact amount of capacity needed, the producer pays for storage only for as long as it is needed, the elevator handles the grain and guarantees quality, the elevator can dry the grain, and no additional transportation and handling is required if the elevator merchandises the grain (Edwards 2010).
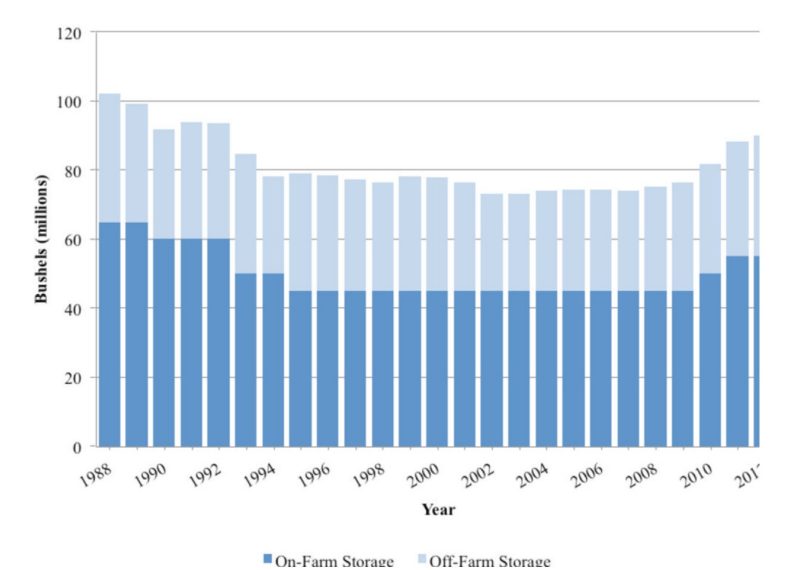
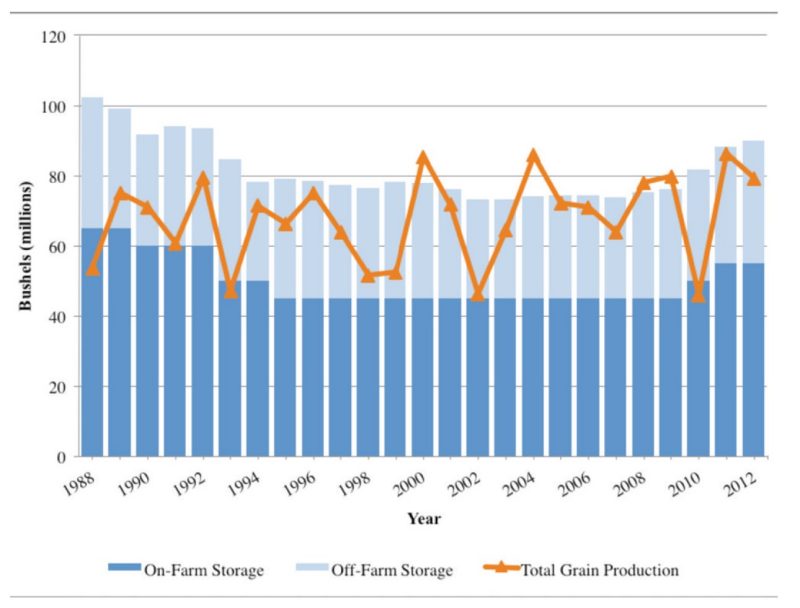
Table 5 contains NASS off-farm and on-farm storage capacity numbers for Virginia from 2008 to 2012. Virginia’s total grain storage capacity in 2012 was 90 million bushels and was composed of 35 million bushels of off-farm storage and 55 million bushels of on-farm storage. The data also reveal that overall storage has increased annually from 2008 to 20128. Historically, with record amounts of on-farm storage, Virginia’s greatest combined storage levels averaged 96.2 million bushels from 1988 to 1992. To illustrate the storage trends graphically, figure 7 shows Virginia’s on- and off-farm capacity numbers from 1988 to 2012.
| Year | Off-farm storage capacity |
On-farm storage capacity |
Total storage capacity |
|---|---|---|---|
| 2012 | 35,000,000 | 55,000,000 | 90,000,000 |
| 2011 | 33,200,000 | 55,000,000 | 88,200,000 |
| 2010 | 31,800,000 | 50,000,000 | 81,800,000 |
| 2009 | 31,300,000 | 45,000,000 | 76,300,000 |
| 2008 | 30,300,000 | 45,000,000 | 75,300,000 |
Source: USDA-NASS (2013b).
Several characteristics are worth noting in figure 7.
- From 1988 to about 1994, total capacity decreased.
- Capacity then remained relatively constant from 1994 to 2009. On average, grain storage capacity was 76.1 million bushels during this 16-year span.
- Since 2007, total capacity has increased every year.
- Grain storage in Virginia is largely characterized by on-farm storage. Specifically, for recent years (2008-12), the on-farm share of total storage is 60.7 percent compared to 39.3 percent held commercially9. In the 25-year period of analysis, commercial storage reached a maximum of 43.1 percent of total state storage in 1995.
While off-farm storage capacity has remained relatively constant, the number of commercial facilities has undergone significant changes. Figure 8 plots the number of off-farm facilities during the period of study (1988-2012)10. Notably, from a high of 196 facilities in 1988 to a low of 78 in 2011 and 2012, the number of off-farm facilities has generally declined over the last 25 years, with decreases slowing in more recent years. This information, coupled with data indicating relatively stable off-farm capacity (fig. 7), suggests that Virginia’s commercial grain facilities have consolidated and each now possesses a greater share of the available storage. The average capacity of a commercial facility in 1988 was 332,000 bushels, compared to 705,000 bushels in 2012 — an increase of 112 percent.
Finally, it is useful to assess where Virginia’s capacity levels fit in terms of larger national trends. Overall, Virginia’s total storage capacity is small relative to other states (USDA-NASS 2013b). More specifically, out of 40 states reporting off-farm storage in 2012, Virginia ranked 32nd in commercial grain storage and 27th in the number of commercial grain storage facilities. Virginia was tied for 27th out of 29 reporting states for on-farm storage capacity in 2012. Though these rankings suggest that capacity is small compared to other states, Virginia’s storage volume closely resembles its production levels. This matter is further explored in Section V.

IV. Location of Storage
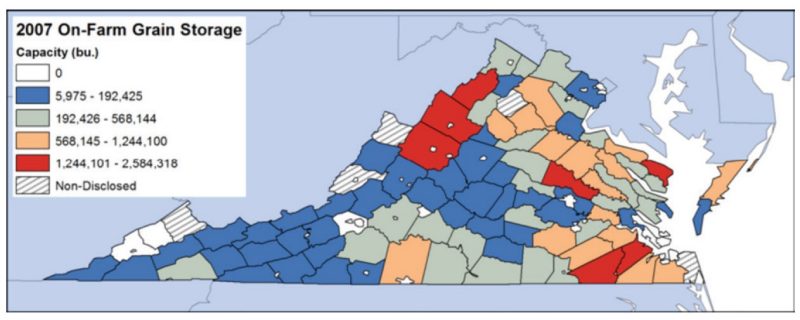
In addition to analyzing trends across time, this study considers the geographic distribution of grain storage capacity11. Table 6 displays the five counties with the greatest on-farm storage and their combined percentage of Virginia’s total on-farm capacity. Just over 24 percent of Virginia’s on-farm storage is concentrated in five counties. This presents evidence of some degree of geographic concentration of on-farm storage.
| Rank | County | Volume (bu) |
|---|---|---|
| 1 | Rockingham | 2,584,318 |
| 2 | Southampton | 2,502,411 |
| 3 | Isle of Wight | 1,775,212 |
| 4 | Shenandoah | 1,558,499 |
| 5 | Augusta | 1,515,255 |
| Total | 9,935,695 | |
| Total on-farm storage (Va.) | 40,970,443 | |
| Top five share of total | 24.3% |
Note: Rankings do not take into account nondisclosed counties.
Source: USDA-NASS (2009).
Figure 9 presents on-farm grain storage capacity for Virginia counties in 2007 and indicates that farm storage is particularly concentrated in the Shenandoah Valley and Tidewater region. These areas reflect some of Virginia’s primary grain-producing areas. It is important to note, however, that much of the storage capacity in the Shenandoah Valley is used in support of the state’s poultry production and is unavailable for use in other distribution channels.
V. Joint Consideration of Grain Production and Storage Across Time
In practice, production and storage are not separate decisions. On-farm storage allows producers to capture profit opportunities through timely sales of grain (O’Brien 2000). In off-farm storage facilities, elevators buy and store grain, facilitate its transportation, and connect buyers and sellers (Henderson and Fitzgerald 2008). Given the link between production and storage, it is important to compare levels of Virginia grain production and total storage capacity. Figure 10 considers this relationship by overlaying the depiction of Vir- ginia’s total grain production (fig. 2) and total storage capacity (fig. 7) from 1988 to 2012. As shown in the graph, although Virginia has lower levels of grain storage compared to other states (Section III), the capacity appears to meet and often exceed production. Across the 25-year span, there was an average storage capacity surplus of 13.9 million bushels. Figure 10 shows that 21 years had excess storage with surpluses averaging 17.8 million bushels per year, and four years had deficit storage with shortages averaging 6.3 million bushels per year.
While figure 10 offers a useful snapshot of total grain production and capacity, it masks the important movements in these markets. In reality, grain rarely enters the marketing channels all at once, and not all of it moves directly into storage once harvested. Another limitation is that some grain flows into Virginia’s storage from outside the state and vice versa12.
It is useful, however, to compare grain production volume relative to storage potential. In order to obtain a more intuitive view of the relationship between storage and production, figure 11 portrays the years of excess and deficit grain storage. As shown in the graph, from 1988 to 1993, Virginia’s storage capacity considerably exceeded the state’s grain production. In fact, total grain production exceeded capacity in only four years (2000, 2004, 2008, and 2009) and some recent surpluses (2005, 2006, and 2011) were relatively small.
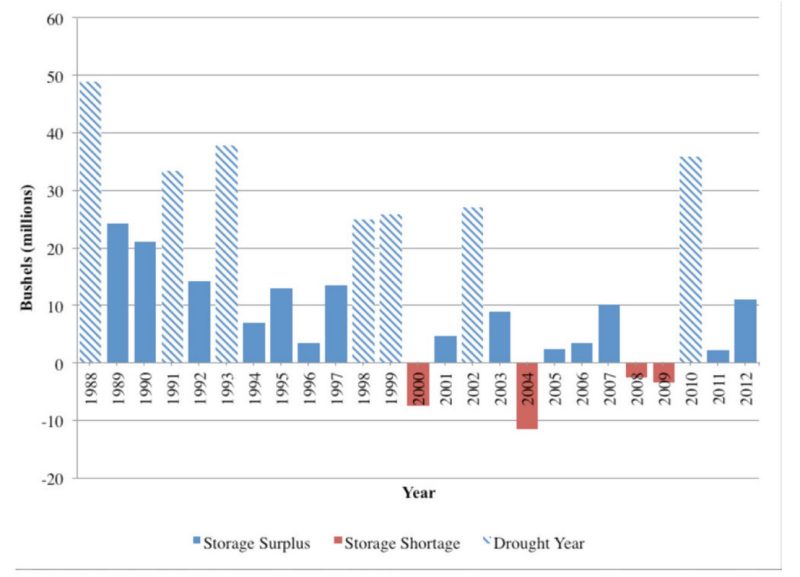
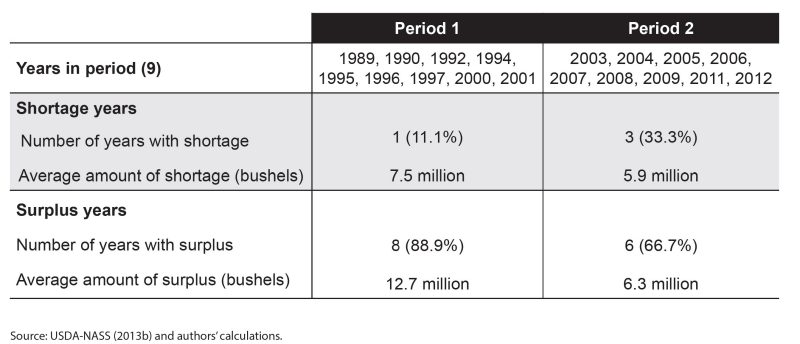
These observations suggest that Virginia’s grain storage has become more constrained in recent years. This outcome is supported by the results in table 7, which presents findings of a two-period analysis that considers the storage shortages and surpluses of normal production years13. The periods were developed by splitting Virginia’s 18 low-productivity years into two periods of nine years each. When compared, the second period experienced not only more years with a storage deficit than the first period, but also a smaller average surplus in years of storage excess. Importantly, these measures suggest that storage has likely been hampered to a larger degree in recent years compared to the past. They also imply that if production experiences periods of significant growth, the current capacity levels for storing grain may not be sufficient and more shortage years may occur.
Table 7. Two-period comparison of Virginia’s storage shortages and surpluses under normal grain production years.
VI. Conclusions and Policy Implications
From poultry, cattle, and hog operations to tobacco, tomatoes, grain, and soybeans, Virginia offers a wide agricultural portfolio. Within this collection, Virginia produces a number of grains, including barley, corn, sorghum, oats, rye, triticale, soybeans, and wheat. Of these, corn and soybeans dominate grain production, followed by wheat and barley. Much of Virginia’s grain production comes from the Shenandoah Valley, Northern Neck, Middle Peninsula, Tidewater region, and Eastern Shore. Overall, Virginia’s grain growers produced a record high 86 million bushels in 2011 and generated an average of 73.7 million bushels over the last five years (2008-12).
With respect to Virginia’s grain storage capacity, data reveal that capacity levels have been fairly consistent over time and on-farm storage capacity is approximately 61 percent of total storage capacity. The number of commercial facilities decreased considerably since 1988, but this decline has slowed in recent years. Overall, in comparison to other states, Virginia’s storage capacity is relatively low, which may present opportunities for expansion.
Combining the production and storage data reveals that capacity has been more challenged in recent years than in the past when storage consistently met grain output levels. This information is important because it implies that if Virginia grain production increases substantially, storage may also need to increase to facilitate its distribution at the desired time. The majority of this increase might come from farms if on-farm storage levels remain around 60 percent of total capacity.
The information presented offers policy-relevant insight that will be useful for several stakeholder groups. For instance, in the event of increasing grain production and subsequent storage shortages, a series of questions would need to be addressed concerning the financing of future storage construction, the location of future storage facilities, the type of future capacity (on-farm versus commercial), the creation of economic incentives conducive to the expansion of storage capacity, and an aging farming population that may be unwilling to invest in new storage facilities. Private enterprises, state and local governments, producer associations, industry boards, cooperatives, and farmers should be actively involved and have a role in these decisions.
This study suggests several areas for potential future research.
- A study that examines where and how much commercial storage exists and conducts a spatial analysis of the state’s production and storage areas would offer important and geographically refined insight into likely locations of future storage constraints.
- Research examining the flow of grain in, out, and within Virginia and considering the stocks of grain at various times during the year in different geographic areas would help to further understand and resolve possible storage capacity constraints.
- Understanding of this sector would be further enhanced by examining two additional and integral components of the supply chain — the grain transportation network and the demand for grain by Virginia’s livestock industries.
Combined, this information would offer additional insights into both the current function and expansion potential of Virginia’s grain sector.
Acknowledgements
The authors would like to express their thanks and appreciation to Keith Balderson, Virginia Cooperative Extension agent, agriculture and natural resources, crop and soil sciences, Essex County; S. Gary Bullen, North Carolina Extension associate, agricultural and resource economics, North Carolina State University; David L. Holshouser, associate professor and Virginia Cooperative Extension agronomist, Tidewater Agricultural Research and Extension Center; and David M. Moore, senior Virginia Cooperative Extension agent, agriculture and natural resources, crop and soil sciences, Middlesex County, for their review and comments.
References
Caffarelli, Peter, Gustavo Ferreira, Gordon Groover, and Kathryn Boys. 2013. “Virginia’s Grain ‘Imports’ by Rail: A Summary.” Farm Business Management Update, August 7. http://news.cals.vt.edu/fbm-update/2013/08/07/virginias-grain-imports-by-rail-a-summary.
Dhuyvetter, Kevin C. 1999. “On-farm vs. Commercial Grain Storage in Kansas.” Paper presented at the Risk and Profitability Conference, Manhattan, Kan., Aug. 19-20, 1999. www.agrisk.umn.edu/cache/ARL01317.pdf.
Edwards, William. 2010. “Grain Storage Alternatives: An Economic Comparison.” Ag Decision Maker Website. Iowa State University Extension and Outreach. File A2-35. www.extension.iastate.edu/agdm/crops/pdf/a2-35.pdf.
Henderson, Jason, and Nancy Fitzgerald. 2008. “Can Grain Elevators Survive Record Crop Prices?” The Main Street Economist 3 (3): 1-7. www.kansascity-fed.org/publicat/mse/MSE_0308.pdf.
Kohls, Richard L., and Joseph N. Uhl. 1998. Marketing of Agricultural Products. 8th ed. Upper Saddle River, N.J.: Prentice Hall.
O’Brien, Daniel M. 2000. Grain Marketing Plans for Farmers. Kansas State University Agricultural Experiment Station and Cooperative Extension Service. Publication MF-2458. http://agmarketing.extension.psu.edu/Commodity/PDFs/mf2458.pdf.
USDA-ERS (U.S. Department of Agriculture, Economic Research Service). 2013. “Organic Production.” USDA-ERS Website. www.ers.usda.gov/data-products/organic-production.aspx#25766.
USDA-NASS (U.S. Department of Agriculture, National Agricultural Statistics Service). 2009. “Virginia State and County Reports.” 2007 Census Publications. USDA Census of Agriculture Website. www.agcensus.usda.gov/Publications/2007/Full_Report/ Census_by_State/Virginia/.
USDA-NASS (U.S. Department of Agriculture, National Agricultural Statistics Service). 2013a. Grain Stocks. USDA-NASS Report. ISSN: 1949-0925. http://usda01.library.cornell.edu/usda/nass/GraiStoc//2010s/2013/GraiStoc-01-11-2013.pdf.
USDA-NASS (U.S. Department of Agriculture, National Agricultural Statistics Service). 2013b. “Quick Stats.” USDA-NASS Website. www.nass.usda.gov/Quick_Stats/.
VDACS (Virginia Department of Agriculture and Consumer Services). 2013. “Virginia Agriculture: Facts and Figures.” Virginia Department of Agriculture and Consumer Services Website. www.vdacs.virginia.gov/agfacts/.
1 The crops included in the calculation are barley, corn, soybeans, and wheat.
2 According to the most recent and available NASS survey reports (USDA-NASS 2013b), in 2004, 5,000 acres of grain sorghum were planted and 2,000 acres were harvested for grain. In 1999, 80,000 acres of rye were planted and 8,000 acres were harvested. Rye is primarily planted as a cover crop in Vir- ginia. In 2012, 11,000 acres of oats were planted and 4,000 acres were harvested for grain. Planting data for triticale are not available.
3 In 2011, Virginia had 369 acres of organic barley, 1,252 acres of organic corn, 676 acres of organic soybeans, and 34 acres of organic wheat (USDA-ERS 2014).
4 Due to rounding, the total adds to 100.1 percent.
5 In the census, NASS collects agricultural data on 95 counties and an additional three independent cities (Chesapeake, Suffolk, and Virginia Beach). NASS still collects data on an annual basis but does not publish the results for all of Virginia’s agricultural counties and independent cities. For instance, in its annual release, NASS published data on 72 counties for corn production and 16 counties for barley production. This stands in contrast to the NASS census, which offers agricultural production data for all 98 areas. Thus, though less recent than annual NASS survey data, the 2007 census was used for its county-level coverage.
6 In the census, NASS collects agricultural data on 95 counties and an additional three independent cities (Chesapeake, Suffolk, and Virginia Beach). NASS still collects data on an annual basis but does not publish the results for all of Virginia’s agricultural counties and independent cities. For instance, in its annual release, NASS published data on 72 counties for corn production and 16 counties for barley production. This stands in contrast to the NASS census, which offers agricultural production data for all 98 areas. Thus, though less recent than annual NASS survey data, the 2007 census was used for its county-level coverage.
7 ESRI GIS Dictionary (online), s.v. “Jenks’ optimization,” accessed July 10, 2013; http://support.esri.com/en/knowledgebase/Gisdictionary/browse.
8 NASS does not have storage data for Virginia prior to 1988.
9 These results are similar to the overall span from 1988 to 2012 where the proportions are 60.8 percent for on-farm and 39.2 percent for off-farm storage.
Virginia Cooperative Extension materials are available for public use, reprint, or citation without further permission, provided the use includes credit to the author and to Virginia Cooperative Extension, Virginia Tech, and Virginia State University.
Virginia Cooperative Extension is a partnership of Virginia Tech, Virginia State University, the U.S. Department of Agriculture (USDA), and local governments, and is an equal opportunity employer. For the full non-discrimination statement, please visit ext.vt.edu/accessibility.
Publication Date
September 26, 2019