

Income Over Feed Costs in the Dairy Enterprise
ID
DASC-51P
 EXPERT REVIEWED
Typically, feed costs are directly related to milk production, so the more you feed, the more you produce. However, milk production is not necessarily related to profitability. Production-oriented management, which focuses on maximizing outputs (i.e., milk yield) through increased utilization of inputs (i.e., feed), does not necessarily ensure the dairy business will be profitable.
Monitoring financial performance and production efficiency on a frequent basis is necessary for the economic sustainability of the dairy business at all times, and it is critical during times of low milk prices, high feed prices, or both. Income over feed costs (IOFC) is one of numerous financial performance indicators that managers can apply to support profitable decision-making. Calculating, understanding, and using IOFC in day-to-day management is the focus of this publication.
The Essence: Milk Yield, Milk Price, and Feed Costs
Income over feed costs is defined as the portion of income from milk sold that remains after paying for purchased and farm-raised feed used to produce milk. In other words, IOFC is the net income after paying feed costs.
For simplicity, IOFC is typically calculated on a per cow and day basis. For this calculation, three parameters must be known: milk yield (lb/cow.day), milk price ($/cwt), and feed costs ($/cow.day). To calculate feed costs, the ingredient composition of the diet being fed (lb/cow.day) and the price of each ingredient ($/ton) must be known. Table 1 provides an example of how to calculate IOFC.
Feed expenses are the major expenses at the dairy farm. Using the figures in the table 1 example, 56.2 percent of income from milk sales was used to feed the cows ($7.73/$13.75 x 100). The remaining $6.02, which is the IOFC, is the amount left to pay other expenses, such as labor, family living, veterinary supplies, repairs, fuel, interest on loans, and depreciation, to name a few.
| Estimating Income over Feed Costs |
|---|
Income: $13.75/cow.day Milk production: 76.4 lb/cow.day Milk price: $18/cwt 76.4 lb/cow.day @ $18/cwt Feed costs: $7.73/cow.day Corn silage: 55 lb/cow.day @ $38/ton = $1.05/cow.day Alfalfa hay: 6 lb/cow.day @ $200/ton = $0.60/cow.day Concentrate: 27 lb/cow.day @ $450/ton = $6.08/cow.day Income over feed costs: $6.02/cow.day |
Individual Milk Yield Versus Milk Tank Yield
There are certain hidden factors that can affect the interpretation of IOFC. One such factor is the difference between produced and shipped milk. To illustrate this, consider a dairy herd with 360 milking cows, 19 of which are in the sick pen with their milk discarded. The sick cows and their milk weights are not recorded in the daily shipments (figure 1), but they are fed the same diet as the 341 nonsick cows. To facilitate the example, we will assume that all cows (i.e., sick and nonsick) are fed the diet described in table 1. When calculated on an individual milk-yield basis, IOFC is the same as the one calculated in table 1 ($13.75 – $7.73 = $6.02). Although this is technically correct, the result will be different when the whole herd is considered. Let us now see how this differs and why, considering the whole herd is important to management.
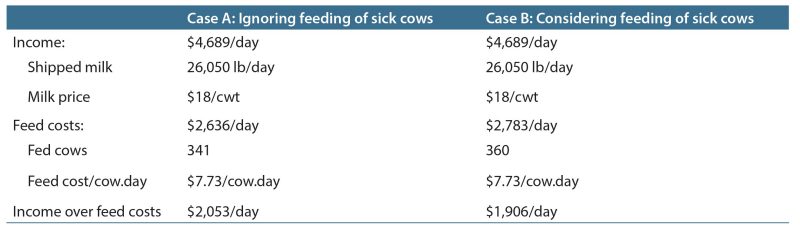
According to the record of daily shipments in figure 1, the average income on a herd basis is $4,689 per day (26,050 lb/day x $18/cwt), the total feed cost on a herd basis is $2,636 per day (341 cows x $7.73/ cow.day), and the IOFC on a herd basis is $2,053 ($4,689 – $2,636; Case A in table 2). However, when the feed costs of the 19 sick cows are ignored, this calculation will result in an overestimation of IOFC. When considering all 360 milking cows being fed the aforementioned diet, the total feed cost on a herd basis is $2,783 (360 cows x $7.73/cow.day), and the IOFC on a herd basis is $1,906 ($4,689 – $2,783; Case B in table 2). This is 7.2 percent less IOFC on a herd basis. In addition to not adding income to the business, sick cows still need to be fed until they are healed or culled. Therefore, feeding sick cows is a hidden expense that dairy farmers typically ignore, which is why measuring IOFC on a herd basis gives a broader perspective of overall management.
In summary, calculating IOFC on a herd basis can give a more accurate indication of the financial performance of the herd than calculating IOFC on an individual cow basis.
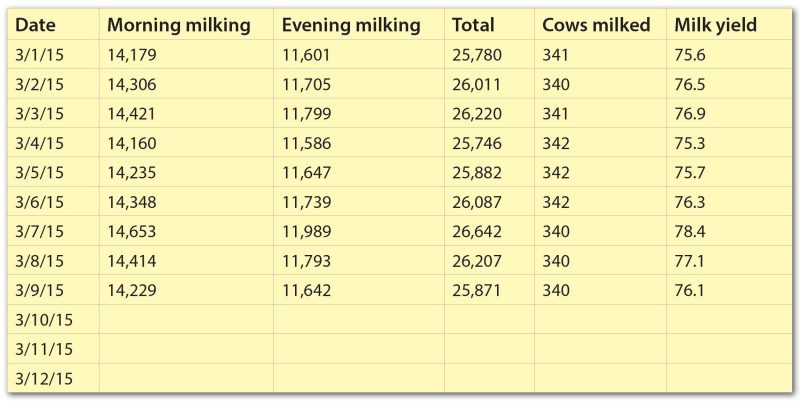
Table 2. Procedure for estimating income over feed costs on a herd basis.
Income Over Feed Costs Beyond Lactating Cows
The composition of the herd also needs to be considered at the time IOFC is calculated. In every herd there is a group of dry cows (i.e., nonlactating cows) that also needs to be fed, although they generate no income. Therefore, there is a negative IOFC for dry cows (table 3).
| Estimating Income over Feed Costs for a Dry Cow |
|---|
Income: $0/cow.day Feed costs: $3.05/cow.day Corn silage: 30 lb/cow.day @ $38/ton = $0.57/cow.day Grass hay: 12 lb/cow.day @ $150/ton = $0.90/cow.day Concentrate: 9 lb/cow.day @ $350/ton = $1.58/cow.day Income over feed costs: $0/cow.day – $3.05/cow.day = −$3.05 |
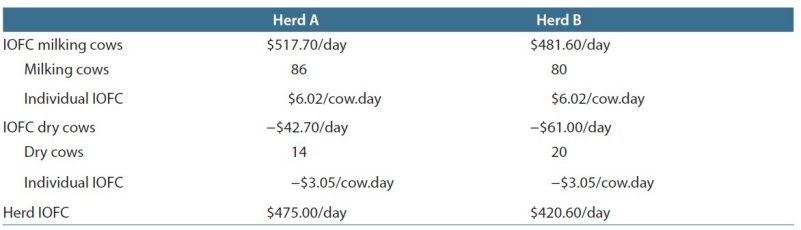
On a whole-herd basis, having a smaller or larger proportion of dry cows can affect IOFC significantly. Consider Herd A with 86 milking cows and 14 dry cows, and Herd B with 80 milking cows and 20 dry cows (table 4). For simplicity, in this example we will use the same values from tables 1 and 3, and we will assume that all milk produced is shipped and sold. On an individual-cow basis, both herds have an IOFC equal to $6.02/cow.day. However, if we estimate IOFC on a whole-herd basis, the conclusions might be different. While Herd A has an IOFC equal to $475.00/day (86 milking cows x $6.02/cow.day + 14 dry cows x −$3.05), Herd B has an IOFC equal to $420.60 (80 milking cows x $6.02/cow.day + 20 dry cows x −$3.05).
Income over feed costs might look good when analyzed on an individual-cow basis, but it is quite different when analyzed on a whole-herd basis. In this case, there is an 11.5 percent difference in IOFC between calculating it on an individual-cow basis and a whole-herd basis.
Table 4. Procedure for estimating income over feed costs on a whole-herd basis considering the composition of the whole herd.
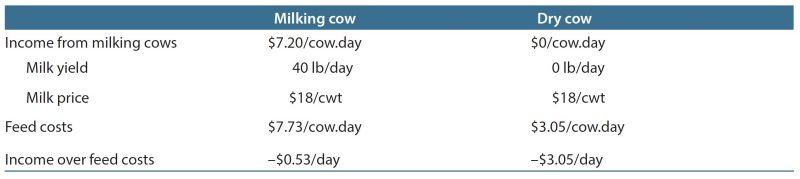
Calculating IOFC also helps herd managers make decisions. For example, many times herd managers might decide to stop milking a cow earlier than expected when IOFC equals zero or, alternatively, “as long as it pays its feed, it will be milked.” Although this is reasonable, it is also important to consider that drying cows in advance because of a neutral IOFC can be more expensive than keeping them milking. This is true even at a negative IOFC. For example (table 5), a 190-day pregnant and lactating cow producing 40 lb/day of milk at $18/cwt and consuming a $7.73/day lactating cow diet has an IOFC equal to –$0.53/day. However, once that same cow is dried and consumes a $3.05/day nonlactating diet, she has an IOFC equal to –$3.05/day. In conclusion, money losses are greater by drying a cow off early than by keeping her milking.
Table 5. Effect of drying a cow based on its income over feed costs.
It is worth clarifying that having a high proportion of lactating or milking cows will not necessarily translate into greater IOFC. Having a balanced proportion of dry cows, typically between 14 and 16 percent of the herd, implies that new calvings or freshenings are expected. These new cows entering the herd should be translated into high-producing lactating cows, which should lead to higher IOFC. Not having these highly efficient cows would definitely be detrimental for the economic sustainability of the farm.
Additional Remarks
Income over feed costs should be calculated and monitored frequently, although this should not become an obsessive behavior. Milk prices typically change every month, so calculating IOFC on a monthly basis can be a good starting point. Also, IOFC should be revised when sudden changes in feed prices occur or when the nutritionist recommends diet changes.
When calculating IOFC on a herd basis, do not overlook the big picture of herd dynamics. In some herds, calvings may be more concentrated in certain months of the year than in others. If this happens, a lower IOFC can be expected during the period with a high proportion of dry cows within the herd.
When benchmarking IOFC, be aware that differences between farms can be related to multiple factors, such as pricing of forages, pricing of purchased or farm-grown grains, or milk price (especially if there is milk commission base included in the latter). Despite the possibility of benchmarking IOFC between farms, it is important to stress that the best use of IOFC is to benchmark against the goals of the farm itself. In other words, regardless of the IOFC in other farms, the question to ask is, “Is my IOFC high enough so that my farm is profitable?”
Take Home Messages
- Estimating IOFC is a good way for knowing where the business stands financially.
- Monitor your IOFC frequently, especially with scenarios of low milk prices, high commodities prices, or both.
- Estimate IOFC on both an individual-cow and a lactating-herd basis.
- Estimate IOFC considering nonlactating cows, especially in cases where dry cows are fed a totally mixed ration diet.
Acknowledgements
The author is thankful to Cynthia Martel, Virginia Cooperative Extension agent, Franklin County Office; Laura Siegle, Virginia Cooperative Extension agent, Amelia County Office; Gordon Groover, Department of Agriculture and Applied Economics, Virginia Tech; and Bob James, professor, Department of Dairy Science, Virginia Tech, for reviewing this article.
This project was supported in part by USDA-NIFA Hatch Project VA-160025 and USDA-NIFA Multistate Project VA-136291 (NC-2042, Management Systems to Improve the Economic and Environmental Sustainability of Dairy Enterprises).
Virginia Cooperative Extension materials are available for public use, reprint, or citation without further permission, provided the use includes credit to the author and to Virginia Cooperative Extension, Virginia Tech, and Virginia State University.
Virginia Cooperative Extension is a partnership of Virginia Tech, Virginia State University, the U.S. Department of Agriculture (USDA), and local governments, and is an equal opportunity employer. For the full non-discrimination statement, please visit ext.vt.edu/accessibility.
Publication Date
September 1, 2020
